Cornell University · Embedded Systems Design Project · Team Member · 2024.11-2024.12 · Published: 2024-12-15
Smart LED Hourglass
An interactive motion-controlled hourglass built with an RGB LED matrix and Raspberry Pi
01 · Files
02 · Project Information
Project Duration: November 2024 - December 2024
Role: Team Leader
Advisor: Prof. Joseph Skovira, Cornell University
Project Type: Embedded Systems Design Project
03 · Project Overview
This project involved the design and development of an interactive Smart LED Hourglass.
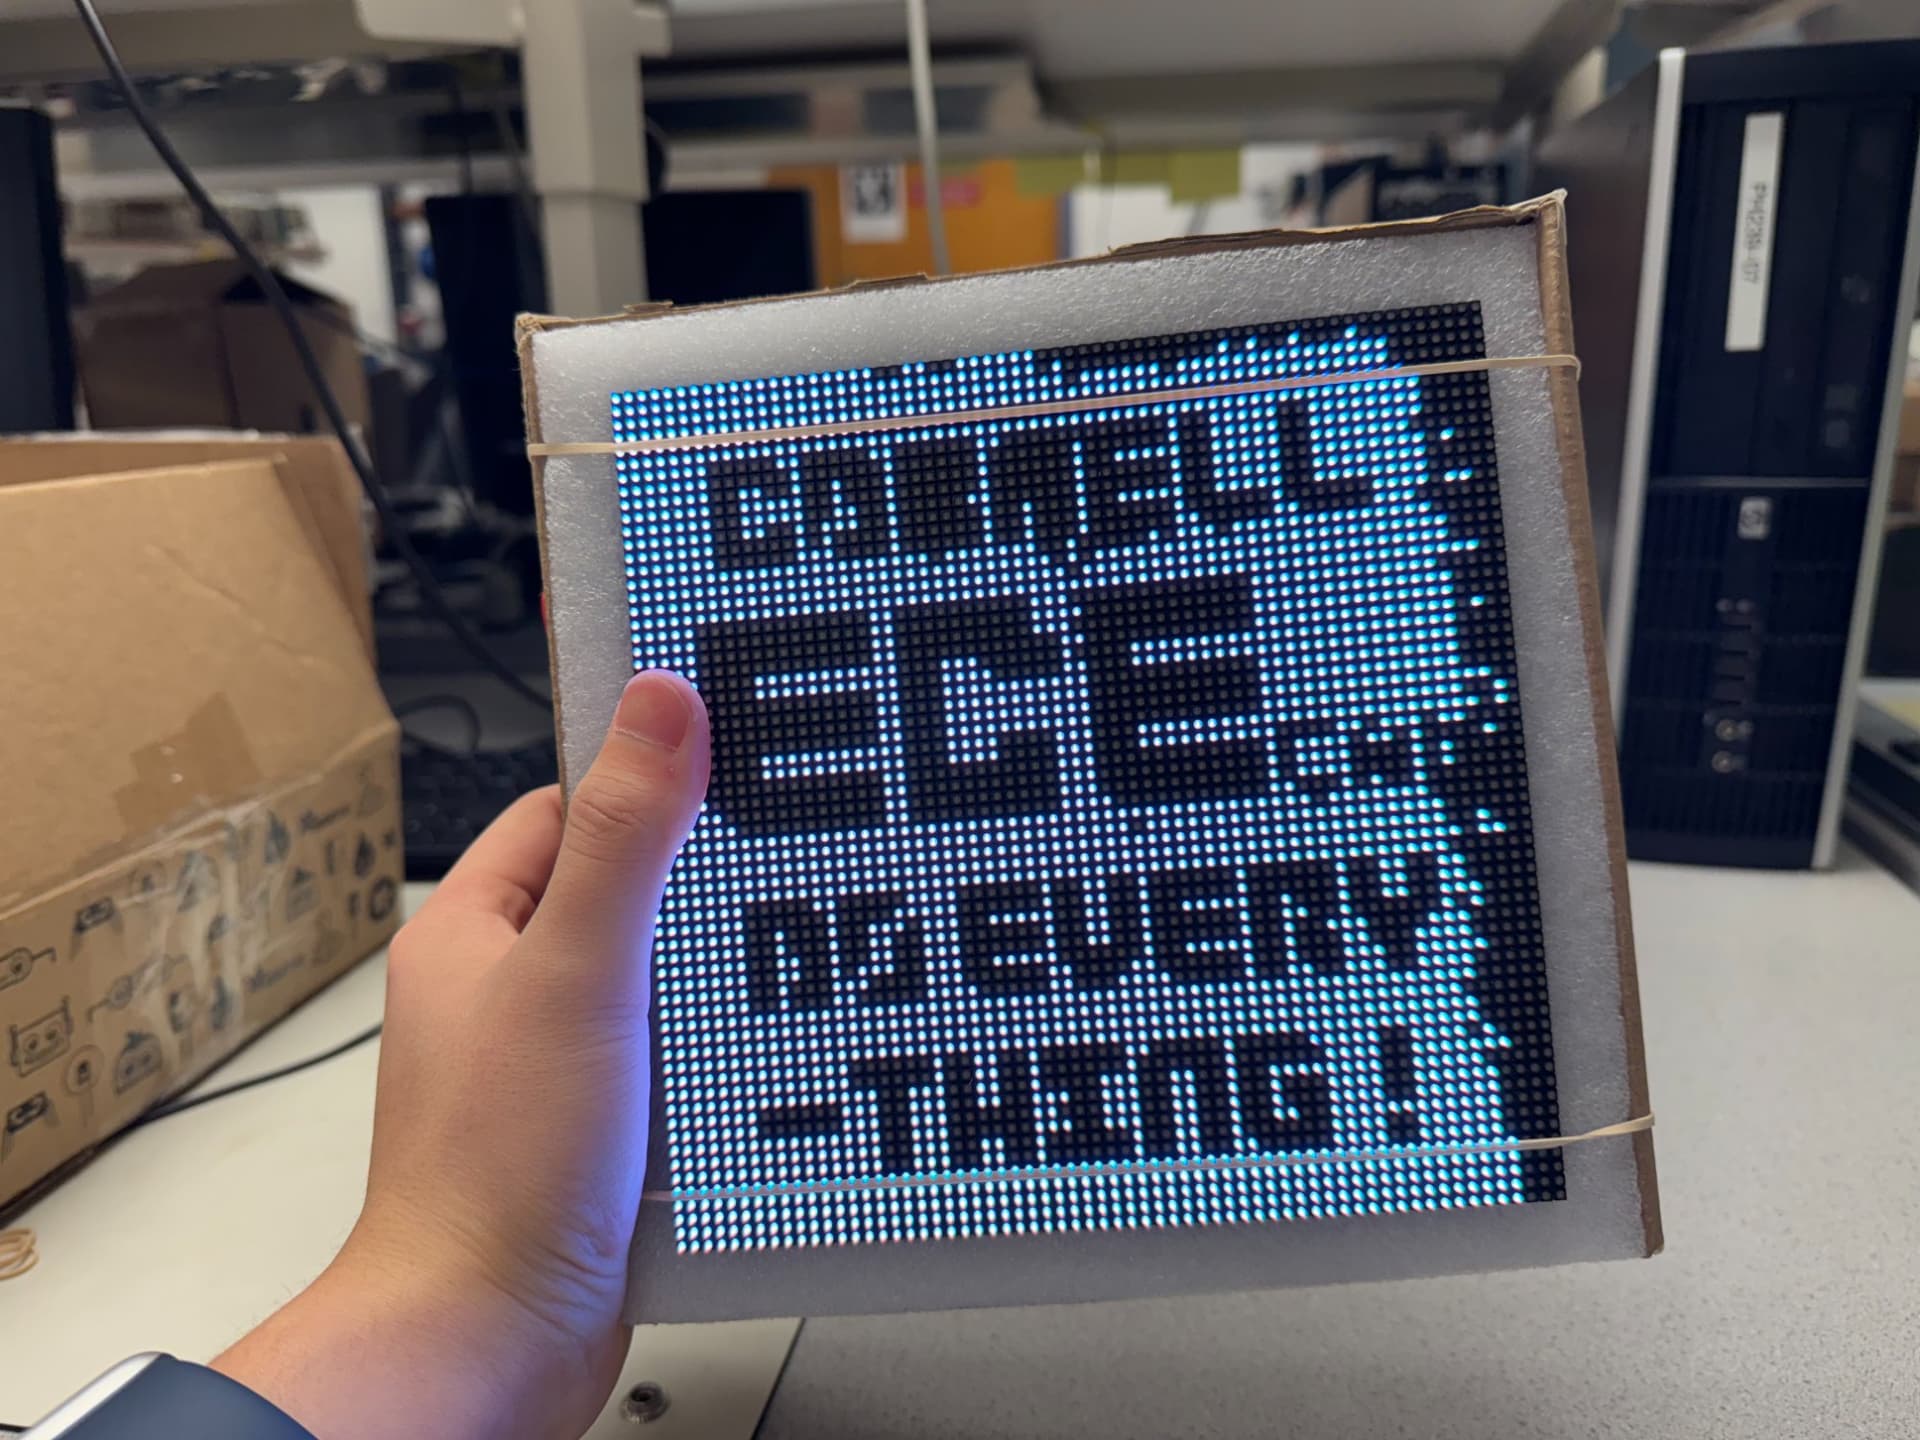
The system used a 64×64 RGB LED matrix to display animated sand particles, a Raspberry Pi as the central processing platform, and a LIS3DH accelerometer to measure device orientation and motion.
When the user rotated or flipped the device, the system recalculated the direction of gravity from the accelerometer data. The virtual sand particles then moved toward the new lower area of the display, reproducing the interactive behavior of a physical hourglass.
In addition to the traditional hourglass simulation, the system included a Cornell logo animation and multiple countdown modes.
04 · Project Objectives
The primary objectives were to:
Simulate physical sand movement on an RGB LED matrix
Detect device orientation through an accelerometer
Adjust sand movement according to the direction of gravity
Produce smooth and continuous particle animations
Support button-based visual mode switching
Reset timers through device movement
Minimize the delay between user input and visual response
Combine embedded control with interactive visual design
05 · Hardware Components
The system consisted of:
Raspberry Pi
64×64 RGB LED matrix
LIS3DH three-axis accelerometer
Mode-selection button
GPIO interfaces
I²C communication
LED matrix driver and power components
Structural and mounting components
The Raspberry Pi read the sensor data, processed user inputs, calculated sand-particle positions, and refreshed the LED matrix.
The LIS3DH accelerometer measured acceleration along three axes, enabling orientation detection and motion-triggered interaction.
06 · System Architecture
The system contained the following modules:
Hardware initialization
Accelerometer data acquisition
Device-orientation detection
Virtual sand simulation
LED matrix rendering
Button interaction
Countdown control
Visual mode management
Motion-triggered reset
These modules were integrated into a real-time loop so that the visual direction of the sand changed immediately when the user flipped the device.
07 · System Workflow
The system followed the process below:
Start the Raspberry Pi
Initialize the RGB LED matrix
Initialize the LIS3DH accelerometer
Configure the button and communication interfaces
Read three-axis acceleration data
Determine the current device orientation
Calculate the virtual gravity direction
Update the sand positions and timer state
Render the new frame on the LED matrix
Check for visual mode changes
Check whether the timer should be reset
Repeat the loop and continuously refresh the animation
08 · Core Functions
1. Traditional Hourglass Simulation
The traditional mode represented sand particles using LED pixels and simulated their movement according to accelerometer data.
When the user flipped the device:
The accelerometer detected the orientation change
The system updated the virtual gravity direction
Sand particles began moving toward the new lower region
The LED matrix continuously refreshed particle positions
The particles gradually moved from the upper region to the lower region
This mode digitally reproduced the interaction of a traditional hourglass.
2. Real-Time Motion Sensing
The LIS3DH accelerometer continuously measured motion along three axes.
The system used the data to determine:
Whether the device had been flipped
The current gravity direction
Whether significant movement had occurred
Whether the timer should restart
The direction in which the particles should move
Motion sensing allowed the animation to respond dynamically to the physical orientation of the device.
3. Sand-Particle Animation
The sand simulation was the primary visual component of the project.
The software continuously processed:
Initial particle positions
Current gravity direction
The next position of each particle
Particle collisions
LED matrix boundaries
Occupied pixel locations
Particle colors
Animation refresh rate
Updating the pixel states over time created a continuous and smooth sand-flow effect.
4. Cornell Logo Sand Mode
The project also included a Cornell logo sand animation.
This mode combined university visual identity with the particle simulation, allowing the Cornell logo to be dynamically represented through LED pixels and moving sand.
It strengthened the project's demonstration value and explored the combination of embedded systems with digital visual design.
5. Countdown Timers
The system provided three countdown modes:
30 seconds
1 minute
5 minutes
The user selected a timer using the control button. During the countdown, the LED matrix displayed the remaining time through particle flow or corresponding visual progress.
A completion state was displayed when the timer reached zero.
6. Button-Based Mode Switching
A physical button allowed the user to switch between the demonstration and timer modes.
The available modes included:
Traditional hourglass
Cornell logo animation
30-second countdown
1-minute countdown
5-minute countdown
The software detected the button input and updated the active operating mode and display content.
7. Motion-Triggered Reset
The system allowed the countdown to be reset through device movement.
When the accelerometer detected a qualifying flip or motion event, the software:
Checked whether the movement exceeded the trigger threshold
Confirmed the new device orientation
Cleared the previous particle state
Reset the countdown
Regenerated the sand particles
Restarted the animation in the new direction
This interaction allowed users to restart the timer by flipping the device like a physical hourglass.
09 · Response Performance
The original interaction-response target was 100 ms.
After optimizing sensor acquisition, state evaluation, and display refresh, the final system achieved a 50 ms response time, exceeding the original target.
The lower latency reduced the delay between device movement, button input, and visual updates.
10 · Software Design
The software was organized around real-time input, state evaluation, physical simulation, and visual rendering.
The primary modules included:
LED matrix initialization
Accelerometer initialization
I²C data acquisition
Button-state detection
Device-orientation calculation
Particle-position updates
Collision and boundary evaluation
Countdown logic
Mode switching
Frame buffering and display refresh
The visual modes and low-level hardware control were separated into relatively independent modules to improve maintainability.
11 · Real-Time Loop
The system processed sensor input and animation updates within a continuous real-time loop.
Each cycle included:
Reading accelerometer data
Calculating the gravity direction
Checking the button state
Determining whether the mode had changed
Updating the countdown
Calculating the next particle positions
Processing boundaries and occupied pixels
Updating the frame buffer
Refreshing the LED matrix
The software controlled the computational load of each cycle to prevent sensor or button processing from interrupting the animation.
12 · Development Process
The project was developed through modular implementation and incremental integration.
The development process included:
Defining the project concept and interactions
Connecting the Raspberry Pi and LED matrix
Testing individual pixels and basic graphics
Configuring the LIS3DH accelerometer
Reading and calibrating three-axis acceleration data
Implementing device-orientation detection
Developing the initial sand animation
Adding boundary and collision logic
Developing countdown functionality
Adding button-based mode switching
Implementing motion-triggered reset
Developing the Cornell logo animation
Optimizing system response time
Completing the final demonstration and testing
13 · Challenges and Solutions
14 · My Responsibilities
As the team leader, I was responsible for:
Defining the project concept and feature scope
Designing the overall hardware and software architecture
Dividing tasks and coordinating project progress
Supporting Raspberry Pi and LED matrix integration
Participating in LIS3DH data acquisition
Designing the sand simulation and gravity-direction logic
Supporting timer and mode-switching development
Organizing system integration and performance testing
Optimizing real-time response
Participating in the Cornell logo visual-mode design
Preparing the project results and final demonstration
15 · Key Contributions and Outcomes
Developed a digital hourglass using a 64×64 RGB LED matrix
Used a Raspberry Pi for real-time animation control
Integrated a LIS3DH accelerometer for orientation sensing
Implemented motion-based sand-flow simulation
Implemented button-controlled mode switching
Implemented motion-triggered timer resets
Developed a traditional hourglass visual mode
Developed a Cornell logo sand animation
Implemented 30-second, 1-minute, and 5-minute timers
Achieved a 50 ms interaction response time
Exceeded the original 100 ms response target
Produced smooth animations across multiple visual modes
16 · Conclusion
This project combined embedded systems, motion sensing, pixel animation, and interaction design to create a Smart LED Hourglass that dynamically adjusted particle movement according to device orientation.
Through the project, I strengthened my skills in Raspberry Pi development, RGB LED matrix control, I²C sensor communication, real-time input processing, and animation-state management.
The project also improved my experience in system architecture, hardware-software integration, team coordination, performance optimization, and interactive product design.